Every UAE short-term rental operator faces the same strategic question: where do I put my primary effort — Airbnb or Booking.com? The honest answer is: both, through a channel manager. But understanding the genuine differences between these two platforms for UAE properties is critical for optimizing your listing content, pricing strategy, minimum stay policies, and guest communication style on each platform to maximize total revenue.
Airbnb vs Booking.com for UAE Properties: Platform-by-Platform Analysis
| Dimension | Airbnb | Booking.com |
|---|---|---|
| Global reach | Strong in North America, UK, Australia, and growing Gulf Arab market | Dominant in Europe, Russia, Middle East, and Asia — broader overall reach |
| UAE guest profile | International tourists (US, UK, Australia, Europe), Gulf Arabs seeking unique/luxury stays | European leisure tourists, Gulf Arab families (Booking.com Arabic UX), Indian tourists |
| Commission rate | Host fee: 3% standard; guest service fee 14–16% | Property commission: 15–18% |
| Review system | Two-way review (guest reviews host, host reviews guest) — encourages mutual positive behavior | One-way guest review — guests rate property; no host review of guests |
| Cancellation policy control | Multiple policy options (Flexible, Moderate, Firm, Strict) — operators choose | Multiple options available; Booking.com can influence cancellation terms |
| Instant booking | Optional — operators can require pre-approval for all bookings | Standard for most properties — guests expect instant confirmation |
| Minimum stay enforcement | Strong minimum stay enforcement; complex rules supported | Minimum stay rules supported but less granular than Airbnb |
| Nightly rate visibility | Guests see nightly rate + service fees during search | Guests see total price during search — can improve perceived value |
| Gulf Arab booking pattern | Gulf Arabs use Airbnb but often prefer the Arabic UX on other platforms | Booking.com's Arabic language UX drives strong Gulf Arab booking volumes |
| Property type preference | Unique stays, home-like experiences, urban apartments, luxury villas | All accommodation types including hotel-like serviced apartments |
Airbnb Strengths for UAE
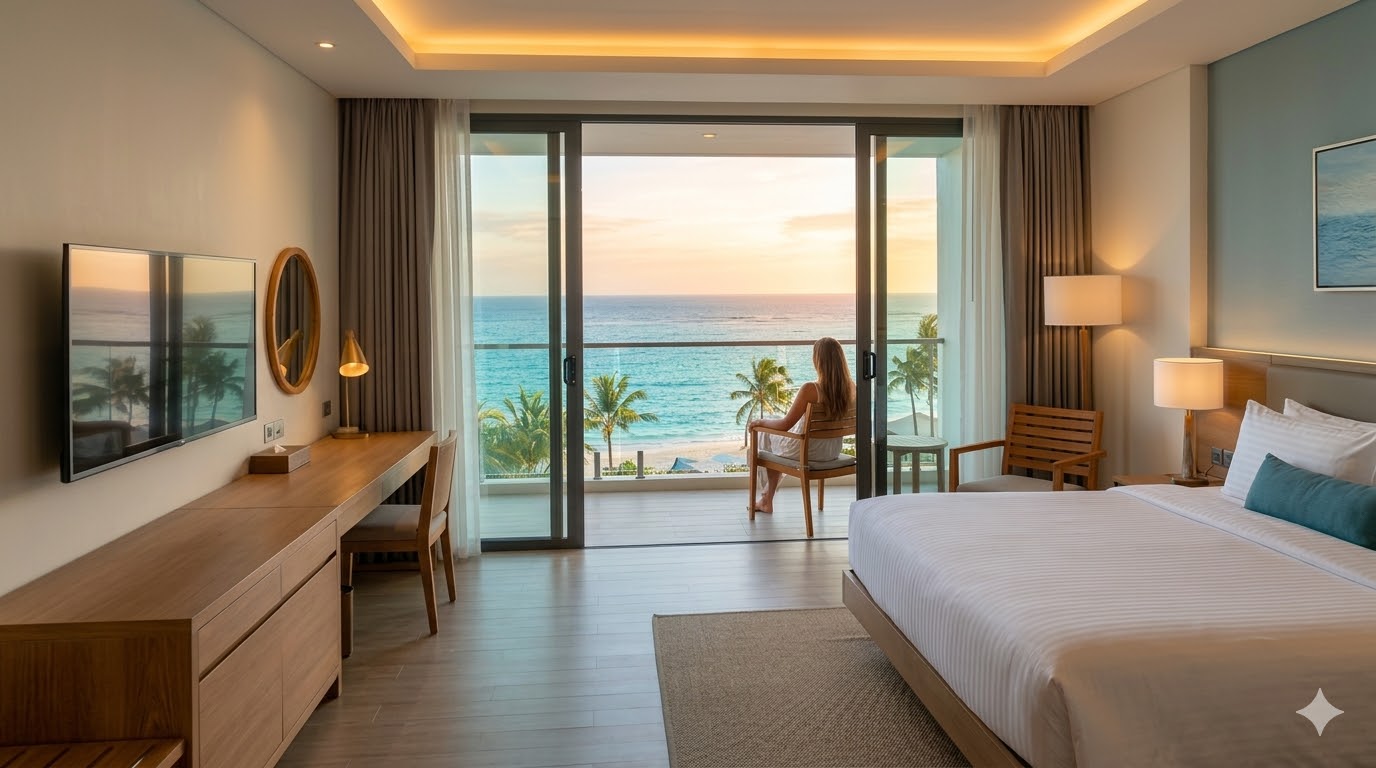
Airbnb's primary UAE strengths are its international brand recognition and its positioning as the platform for authentic, home-like stays. For Downtown Dubai properties with Burj Khalifa views, Palm Jumeirah villas, and Dubai Marina apartments, Airbnb captures the premium segment of international tourists who are specifically looking for STR experiences rather than hotel alternatives. Airbnb also performs strongly for Gulf Arab guests seeking luxury apartment stays and unique villa experiences — the platform's photography emphasis rewards UAE properties with strong photography investment.
Booking.com Strengths for UAE
Booking.com's UAE strengths are its dominant European tourist market penetration and its Arabic-language UX that captures Gulf Arab family bookings effectively. For Dubai Marina and Abu Dhabi properties, Booking.com often generates higher booking volumes from European leisure tourists (German, French, British, Russian, Dutch) than Airbnb — this is the single most important factor for operators whose target market includes significant European segment. Booking.com also performs strongly for Gulf Arab family bookings, particularly in markets like Hurghada and Eid peak travel.
The Right Answer: Both Platforms, Managed Together
| Scenario | Airbnb Focus | Booking.com Focus | Both (GateIn) ✅ |
|---|---|---|---|
| Annual bookings (10-property portfolio) | ~220 bookings/yr | ~240 bookings/yr | ~380 bookings/yr (+70%) |
| Annual revenue | Baseline | Baseline | +25–40% vs single platform |
| European tourist coverage | Partial | Full | Full (both platforms) |
| Gulf Arab family coverage | Partial | Strong | Full (both + direct Arabic site) |
| US/Australian tourist coverage | Strong | Partial | Full (both platforms) |
GateIn's channel manager keeps both platforms (plus 148+ more) perfectly synchronized with zero manual effort — your calendar, pricing, and availability always accurate on every platform simultaneously.
| Properties | Monthly/Unit | Monthly Total | Annual/Unit | Annual Total |
|---|---|---|---|---|
| 1 | $10.00 | $10/mo | $6.70 | $80.40/yr |
| 5 | $9.76 | $48.80/mo | $6.54 | $392.40/yr |
| 10 | $9.45 | $94.50/mo | $6.33 | $759.60/yr |
| 20 | $8.84 | $176.80/mo | $5.92 | $1,420.80/yr |
🎯 15-day free trial — zero commissions, full 150+ platform access from day one.